Using SQL and Power BI, I calculated a direct cost of $1.2M in staff turnover, identifying the specific financial impact of pay unfairness between new and veteran hires and the critical employee groups most likely to quit due to overwork or long promotion delays. The dataset was pulled from Kaggle. The dashboard and SQL queries are available in the README.

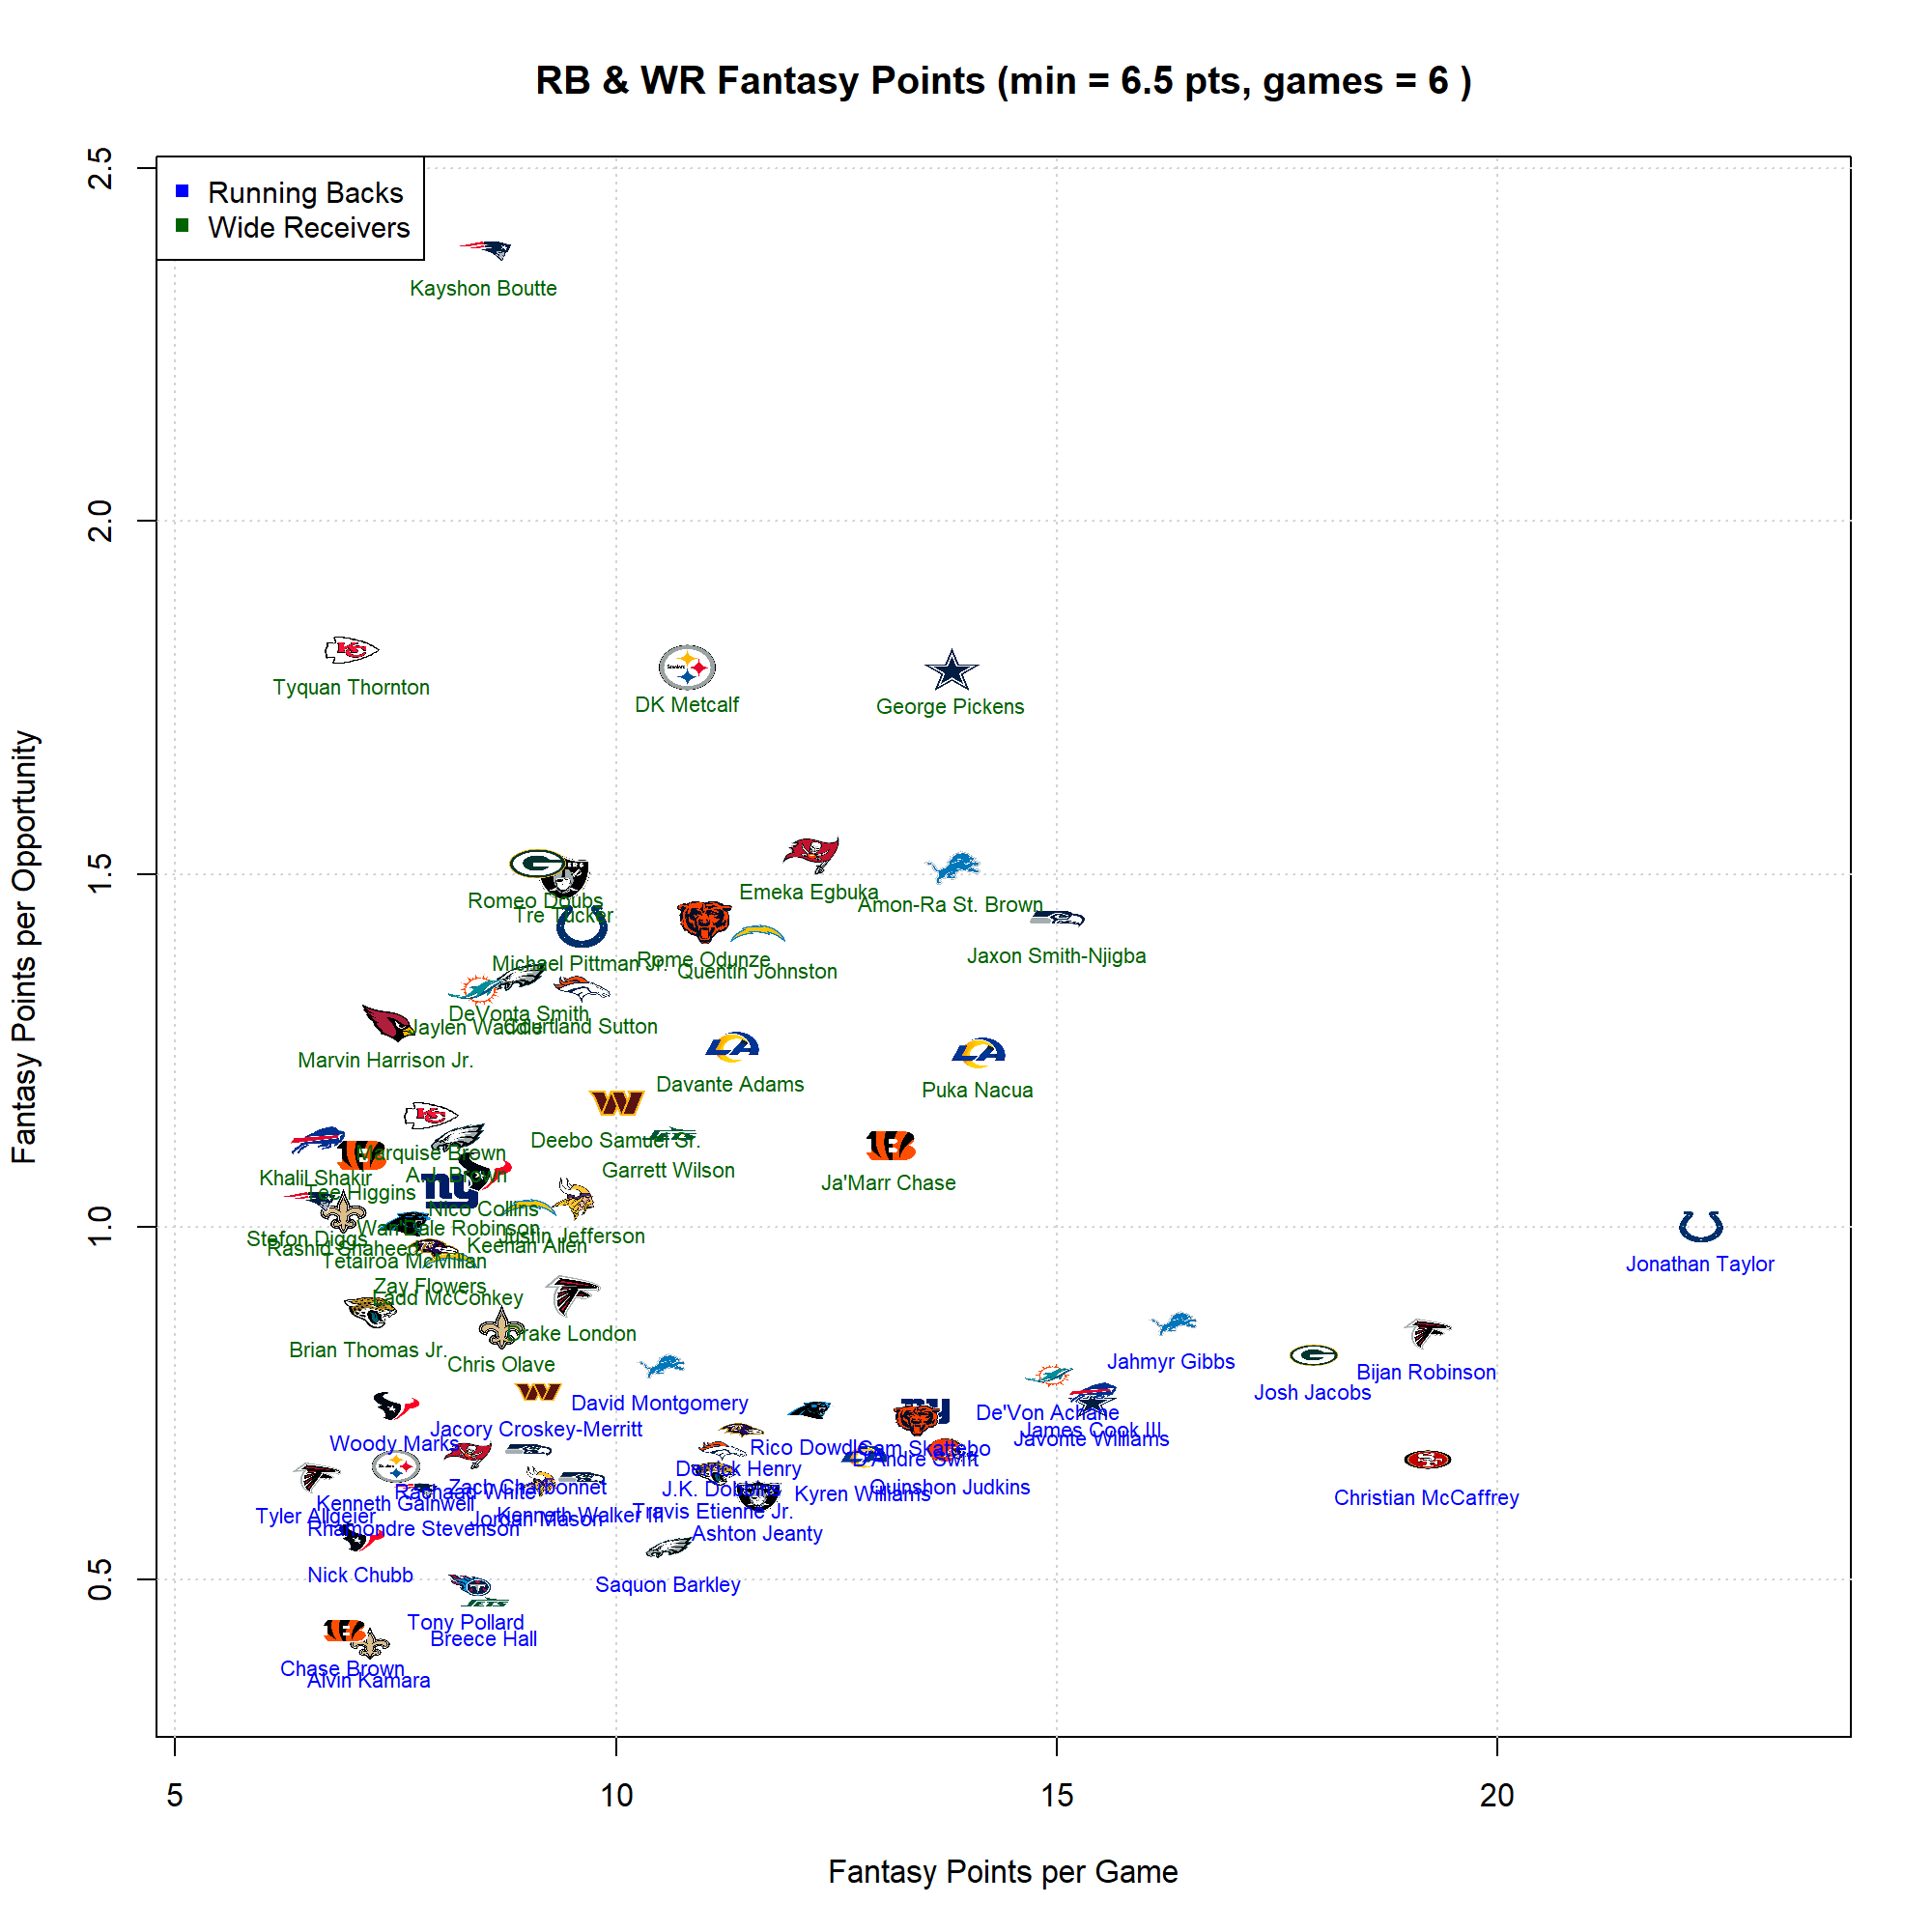
Using Linear Regression in R, I projected end-of-season Fantasy Points for running backs and wide receivers through Week 7. The Combined Plot highlights efficiency by comparing Fantasy Points Per Game to Fantasy Points per Opportunity, helping identify high-performing players and breakout candidates. Model validation shows a strong fit (R² = 0.994), with Actual vs. Predicted points tightly clustered around the y=x line. Based on the model, the top projected players at each position are clearly identified.

In this project, I pulled NFL data from Pro Football Reference using a Python script, and visualized scoring insights using PowerBI. This data is from the 2024-2025 NFL Regular Season. The dashboard preview is available in the README.

In this project, I downloaded a College Basketball dataset from Kaggle. I used this data to create insightful visualizations in Tableau. These visualizations truly analyze team and conference level success over the years in March Madness. The visualizations include a box-and-whisker plot looking at Adjusted Offensive Effeciency by Tournament Round, BARTHAG by Year line chart, Efficiency Trade-off Matrix, and Overperformance heatmap.

In this project, I pulled data from Baseball Savant into Microsoft Access. I created SQL queries to drive further insights into each team's offensive performance. I took these queries and visualized them in PowerBI. The dashboard preview is available in the README. This data was pulled in June 2025.